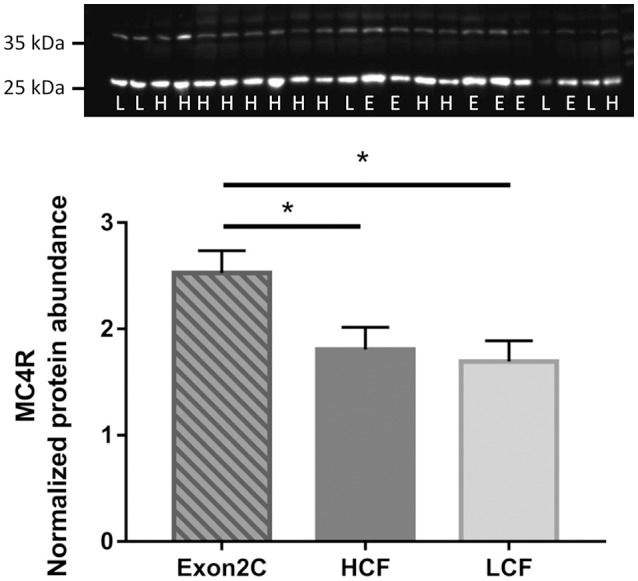
Figure 6.

Quantification of MC4R protein abundance in liver of three groups of F2-generation bulls at 18 months of age (Exon2C, n = 17; HCF, n = 20; LCF, n = 20). A representative western blot image is shown above. H = HCF, high carcass fat; L = LCF, low carcass fat; E, Exon2C. * Indicates significant higher value in Exon2C bulls with P < 0.05.
