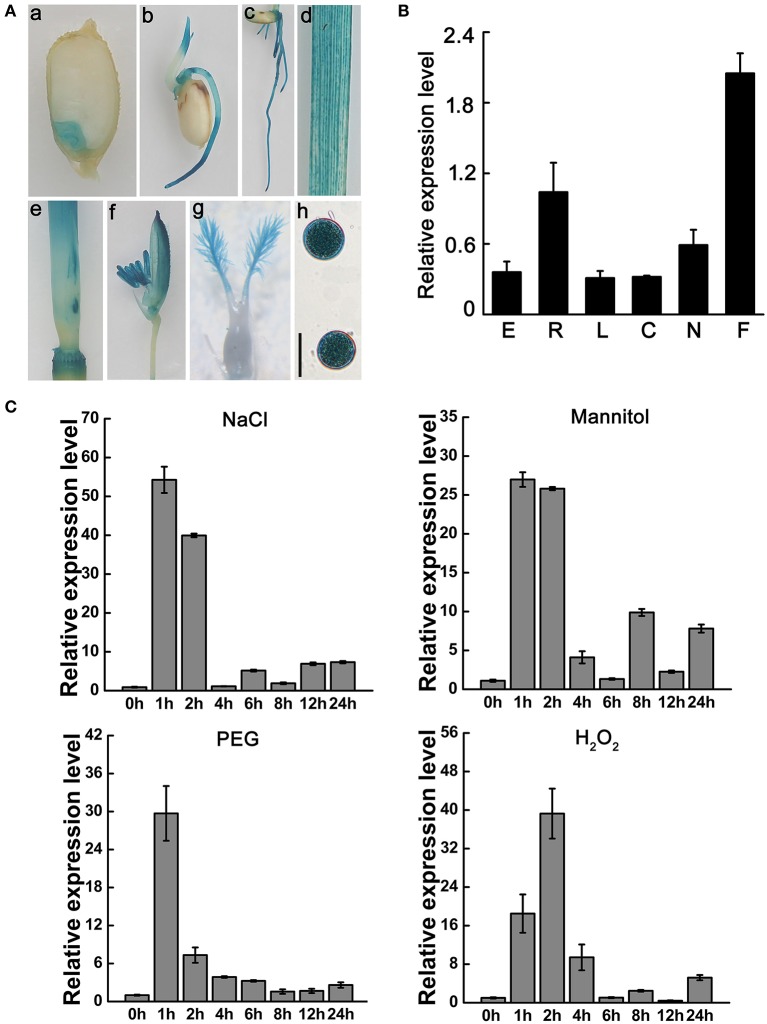
Figure 1.
Expression analysis and subcellular localization of OsNCED3. (A) Histochemical staining of ProNCED3-GUS transgenic plants, including mature seed (a), bud sheath (b), root (c), leaf (d), culm and node (e), flower (f), stigma (g), pollens(h). Bars = 20 μM. (B) Transcription level of OsNCED3 in different organs. E(embryo), R(root), L(leaf), C(culm), N(node), F(flower). (C) OsNCED3 expression in abiotic stress by qRT-PCR. The three-leaf stage seedlings were performed to 150 mM NaCl, 250 mM Mannitol, 25% PEG and 100 mM H2O2 treatment, respectively. The seedling samples were collected for OsNCED3 expression analysis. Data are the mean ± SD for three replicates.

