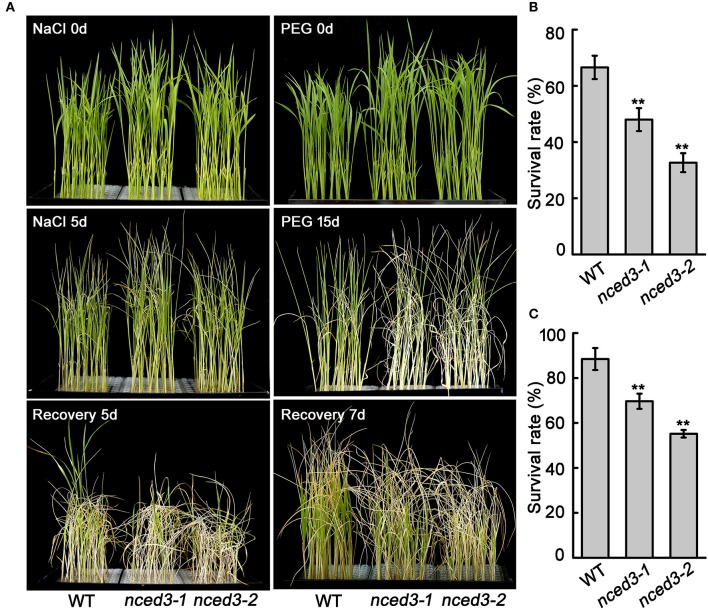
Figure 4.
The nced3 mutants showed decreased salt and PEG stress tolerance. (A) The phenotype of three-leaf stage seedlings of nced3 mutants and wild type under NaCl and PEG stress. (B,C) Statistics for survival rate after salt and PEG stress. The number of surviving plants as a proportion of the total plants is shown. Data shown are ± SD from three independent replicates. Asterisks indicate statistically significant differences (Student's t-test; **P < 0.01).

