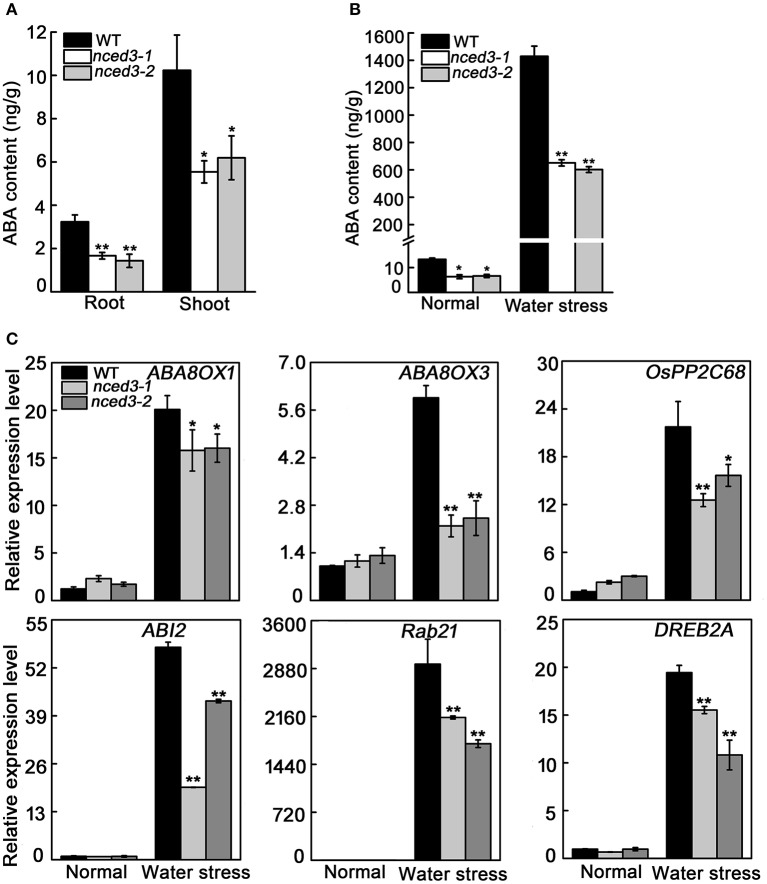
Figure 8.
ABA accumulation and ABA-related gene expression in nced3 mutants. (A) The shoot and roots ABA content in normal condition, (B) The leaf ABA content under water stress, (C) The leaf ABA-related genes expression in wild type and nced3 mutants three-leaf stage seedlings under water stress for 5 d. Data shown are ± SD from there independent replicate. Asterisks indicate statistically significant differences (Student's t-test; *P < 0.05, **P < 0.01).

