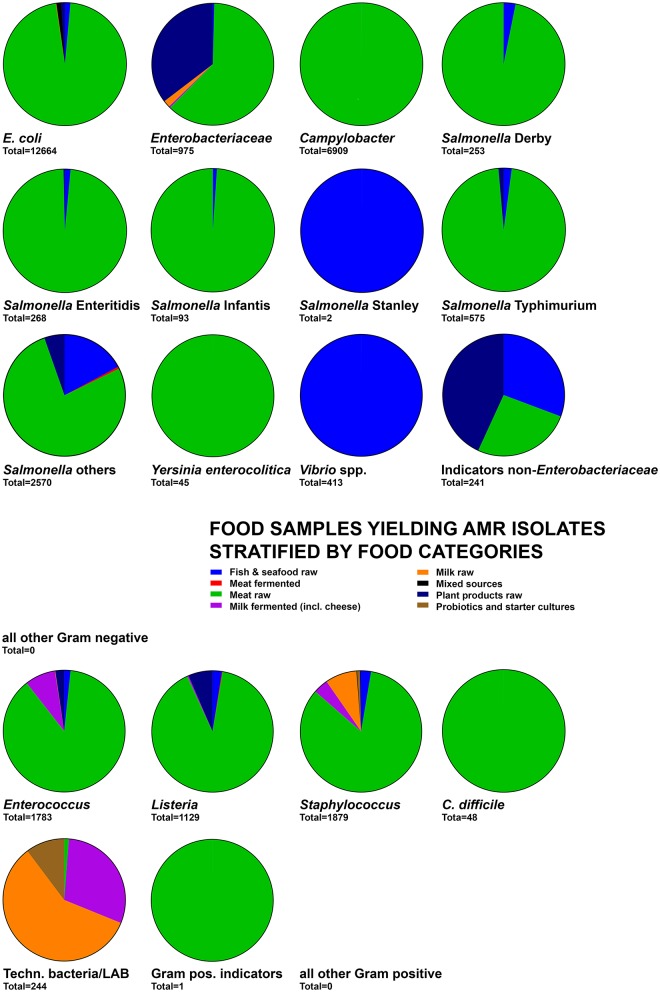
Figure 2.
Distribution of the number of food samples detected positive for AMR isolates and stratified by food categories. The total below each pie chart indicates the total of samples used to calculate the graph. For other Gram-negative, other Gram-positive, and Gram-positive indicator groups, no or only limited quantitative sample association was possible and thus no diagram was obtained despite the presence of AMR phenotypes in these groups.

