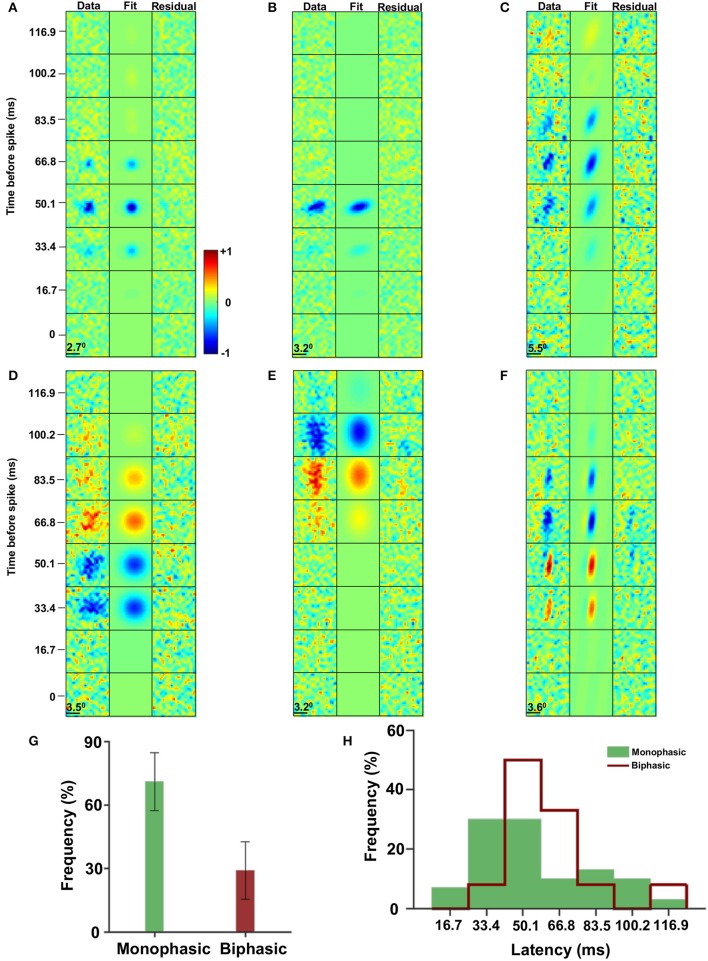
Figure 2.
Spatiotemporal receptive fields. (A–F) The spatiotemporal receptive fields are characterized by temporal monophasic (A–C) and biphasic (D–F) leading to low pass filter (A–C) and band pass filter (D–F) groups. In addition the eccentricity of the receptive field spatial profile has a broad distribution from nearly circular (A,D) to highly elliptic (C,F). (G) The distribution of monophasic (~2/3) and biphasic (~1/3) receptive fields (with a 95% confidence interval). (H) The distribution of the STA latency response of monophasic (green; 54.5 ± 26 ms, mean ± STD) and biphasic (red line; 60 ± 21 ms, mean ± STD) receptive fields (p = 0.73, permutation test).

