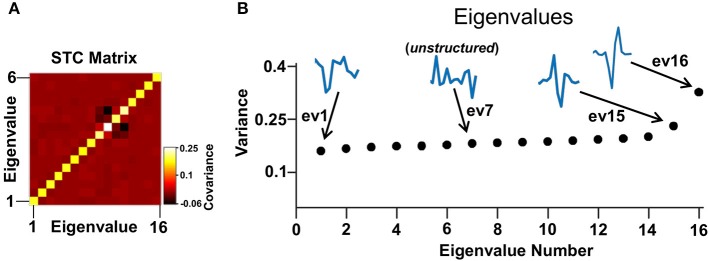
Figure 4.
STC analysis. (A) An example of a STC matrix of a representative cell. (B) The eigenvalues of the STC matrix in (A). In this example there are two excitatory and one inhibitory eigenvalues. Their associated eigenvectors have a defined shape in contrast to a noise level eigenvector that has an arbitrary shape (e.g., eigenvector 7).

