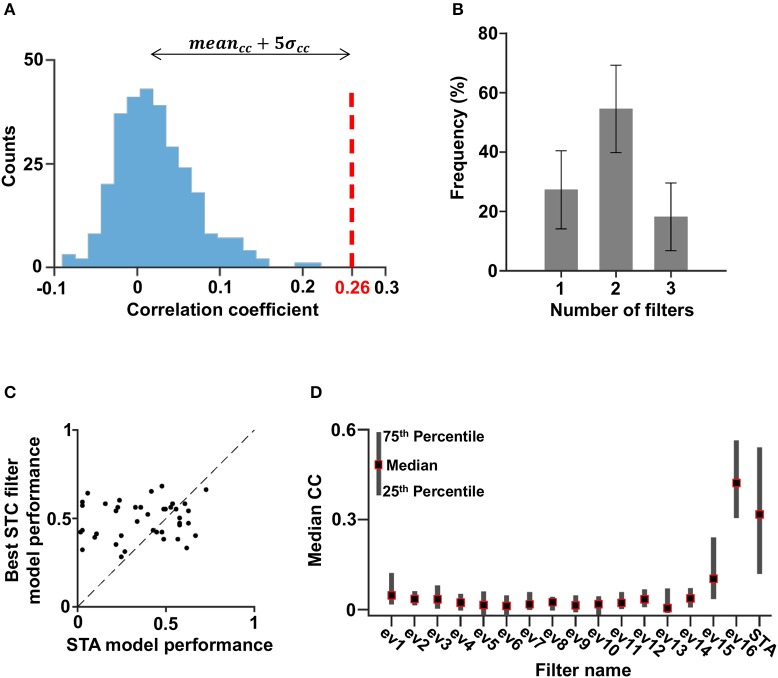
Figure 5.
Filters of significant models. (A) The distribution of the correlation coefficients obtained with eigenvectors 5–10 of all cells. The value of the mean plus five times the standard deviation was set as the cutoff such that models associated with correlation coefficients above this number were considered significant (red striped line). (B) The distribution of the number of filters per cell (with a 95% confidence interval). Most cells had two filters. (C) The correlation coefficient associated with the STA filter vs. the best correlation coefficient associated with one of the STC filters. For 36% of the cells, the highest correlation coefficient was obtained by using the STA filter, and for 64% of the cells, the highest correlation coefficient was obtained by using an excitatory filter. Thus, in most cases the contribution of the STC filter was more significant; hence, the STC analysis made a good contribution to this kind of model. (D) The one-dimensional linear non-linear model correlation coefficient median of all cells.

