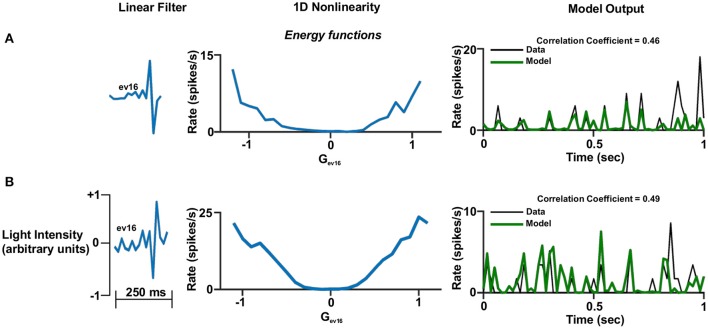
Figure 6.
One dimensional linear non-linear model. (A,B). One dimensional linear non-linear models of two different cells. Left panel: The linear filter. Middle panel: The non-linear function where the generator units are normalized. A constant was added to the function in order for its minimum to be set to zero. This is legitimate since it does not affect the correlation coefficient. Right panel: One second of the real firing rate vs. the model's firing rate prediction. The model's firing rate was multiplied by a constant in order for its amplitude to match the true firing rate. This is legitimate since it does not affect the correlation coefficient.

