Figure 9.

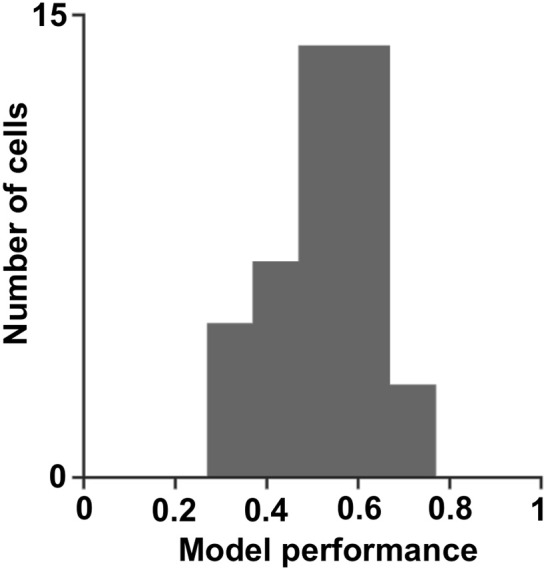
Model performance. A histogram of the correlation coefficients obtained by fitting the linear non-linear model to the cell's true response (0.5 ± 0.1; mean ± STD).

Model performance. A histogram of the correlation coefficients obtained by fitting the linear non-linear model to the cell's true response (0.5 ± 0.1; mean ± STD).