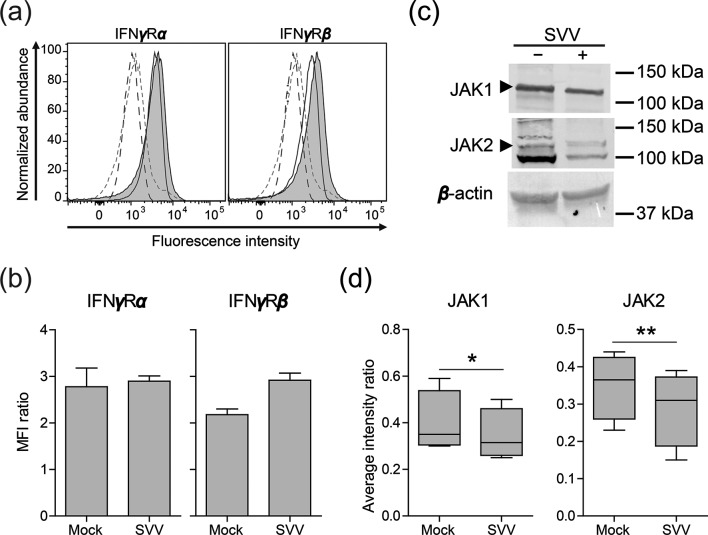
Fig. 3.
SVV infection downregulates JAK1 and JAK 2 protein expression. (a) Histograms showing the expression of the IFNγ receptor alpha (IFNγRα) and beta (IFNγRβ) subunits in mock- and SVV.EGFP-66-infected BSC-1 cells (72 h p.i.) as determined by flow cytometry. Filled (virus-infected) and open (mock-infected) solid lines indicate cells stained with the indicated antibodies. Dashed grey (virus-infected) and black (mock-infected) lines indicate cells stained with isotype control antibodies. (b) The MFI ratio of cells stained for IFNγRα or IFNγRβ, and cells stained using isotype control antibodies, is presented. Data represent average values ± sem from two independent experiments. (c) Mock- and SVV.EGFP-66−infected BSC-1 cells were lysed at 72 h p.i. and probed with antibodies specific for JAK1, JAK2 and β-actin by Western blotting. The arrowheads indicate bands of the appropriate size corresponding to JAK1 (130 kDa) and JAK2 protein (128 kDa). (d) Signal intensities of JAK1 and JAK2 proteins were quantified and normalized to corresponding β-actin protein abundance (e.g. the JAK1/β-actin ratio). Box plots indicate the average intensity ratios from four independent experiments. *P<0.05 and **P<0.01 by paired Student’s t-test.

