Figure 3.
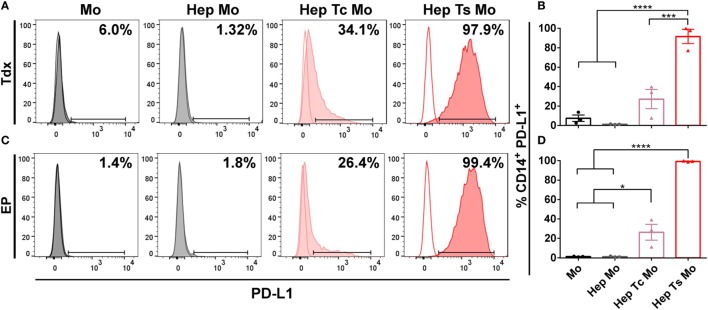
(A,C) Representative histograms of the flow cytometry data of CD14+ PD-L1+ monocytes for co-cultures with either Tdx (A) or EP (C) HBV-specific TCR T cells at 24 h are shown. Tinted and non-tinted histograms, respectively, represent the stained sample or matched isotype control, where a horizontal line is drawn based on the isotype control to demarcate for PD-L1+ cells. Percentage values of CD14+ PD-L1+ cells are indicated. (B,D) Bar plots show the mean ± SEM of PD-L1+ monocytes for co-cultures involving Tdx (B) or EP (D) HBV-specific TCR T cells; bars are drawn where a comparison was made with *P ≤ 0.05, ***P ≤ 0.001, and ****P ≤ 0.0001. Statistical significance was evaluated by a one-way ANOVA with Holm-Sidak’s multiple comparisons test. EP, mRNA-electroporated; HBV, hepatitis B virus; Hep, HepG2-preS1-GFP; Mo, monocyte; Tc, control T cell; TCR T cells, T cell receptor-redirected T cells; Tdx, transduced; Ts, HBV-specific T cell.

