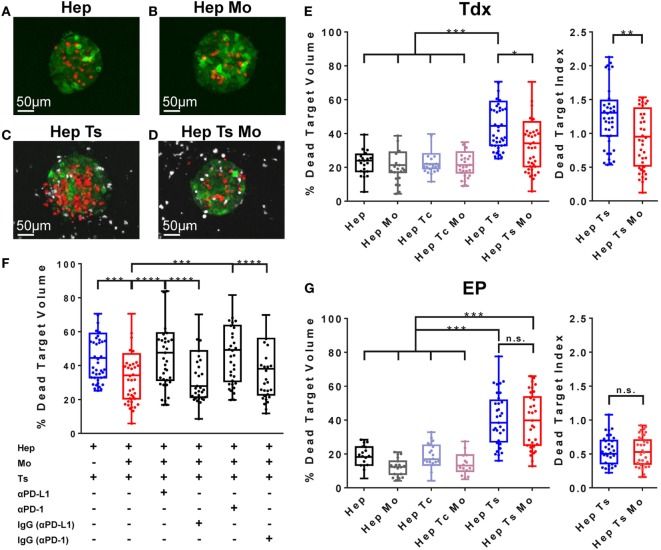
Figure 5.
(A–D) Representative target cell aggregates of the conditions Hep (A), Hep Mo (B), Hep Ts (C), and Hep Ts Mo (D), in which the presence of dead target cells is DRAQ7+ (in red), HBV-specific TCR T cells are labeled with Cell tracker violet dye (in white), while monocytes are unlabeled. (E) Box plot of the percentage of dead target (HepG2-Pres1-GFP) volume after 24 h of co-culture with Tdx HBV-specific TCR T cells. Data in terms of a “Dead Target Index” are also shown where the percentage of dead target volume is normalized to the percentage of TCR+ T cells. (F) Box plot of the percentage of dead target volume after 24 h of treatment with Tdx HBV-specific TCR T cells with or without PD-L1- or PD-1-blocking antibody or their respective isotype (IgG) controls. (G) Box plot of the percentage of dead target (HepG2-Pres1-GFP) volume after 24 h of co-culture with EP HBV-specific TCR T cells. Data in terms of a “Dead Target Index” are also shown. Data points reflect the measured values of individual target cell aggregates and collectively represent the pooled results of three donors, where the 25th, 50th, and 75th percentiles as well as minimum and maximum values are indicated. Bars are drawn where a comparison was made with *P ≤ 0.05, **P ≤ 0.01, ***P ≤ 0.001, and ****P ≤ 0.0001. Statistical significance was evaluated by a one-way ANOVA with Holm-Sidak’s multiple comparisons test. EP, mRNA-electroporated; HBV, hepatitis B virus; Hep, HepG2-preS1-GFP; Mo, monocyte; n.s., not significant; Tc, control T cell; TCR T cells, T cell receptor-redirected T cells; Tdx, transduced; Ts, HBV-specific T cell.

