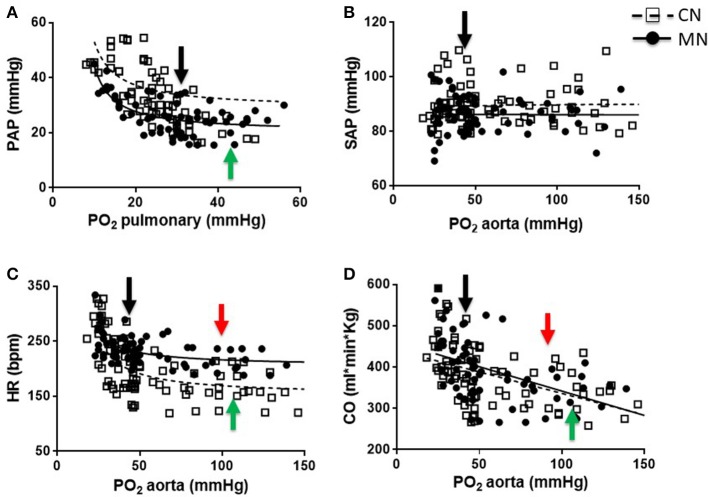
Figure 1.
Cardiopulmonary responses to graded oxygenation. Correlations of PO2 vs. PAP (A), PAS (B), HR (C), and CO (D) during the graded oxygenation protocol. Groups are control (CN, open squares, n = 6) and melatonin treated (MN, closed circles, n = 6) lambs. Values are means ± SEM. Lines represent the non-linear fit for CN (dashed line) and MN (continuous line) animals. Black arrows indicate baseline point at high altitude (breathing room air). Green and red arrows indicate inflection points for CN and MN animals, respectively.

