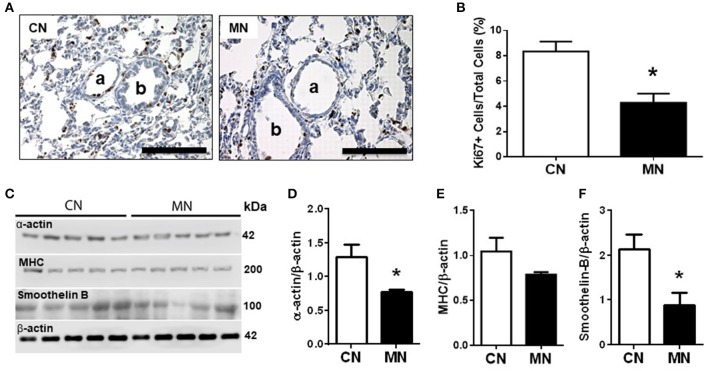
Figure 2.
Pulmonary vascular remodeling. Representative micrographs (40x) of pulmonary tissue showing immunohistochemical distribution of Ki67 on pulmonary arteries (A), and vascular Ki67+ cells/total cells quantification (B). a: arteriole; b: bronchiole; scale bar: 100 μm. Scanned photograph of the Western blots (C); Analyses for α-actin (D), MHC (E), and smoothelin-B (F) protein expression. Protein expression was referred to β-actin as control protein. Groups are control (CN, open bars, n = 5) and melatonin treated (MN, closed bars, n = 5) lambs. Values are means ± SEM. Significant differences (P ≤ 0.05): *vs. CN.

