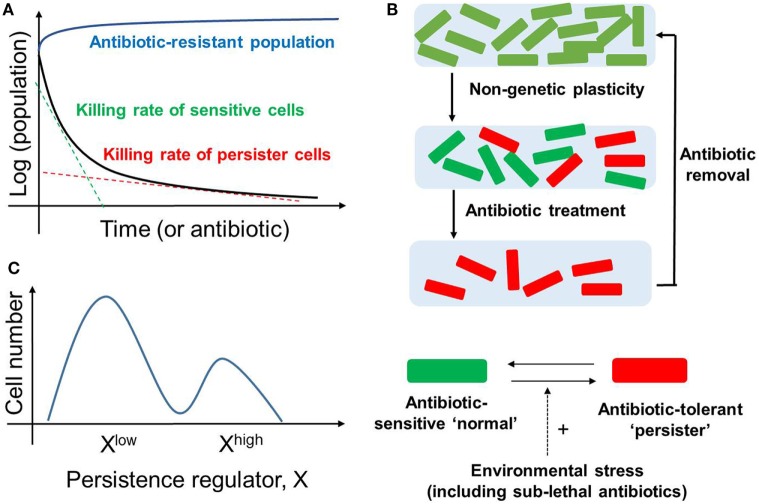
Figure 1.
Bacterial Persistence. (A) Biphasic time-kill curve in bacterial populations exposed to antibiotics: faster killing rate of sensitive cell (green dotted line) followed by a slower killing rate (red dotted line) of persisters. In contrast, the antibiotic-resistant population continues to grow in presence of antibiotic (blue curve). (B) (top) An isogenic population of antibiotic sensitive cells can give rise to persisters via non-genetic/phenotypic plasticity. These slow-cycling persisters survive in the antibiotic treatment and tend to resume growth and generate a new population identical to the original population upon antibiotic removal (bottom). Persisters and non-persisters can switch among one another; the switching rate can be influenced by external stress factors. (C) Non-genetic heterogeneity of a key regulator of persistence (say X) in an isogenic population may give rise to two (or more) subpopulations that may continue switching stochastically among themselves to maintain persisters.

