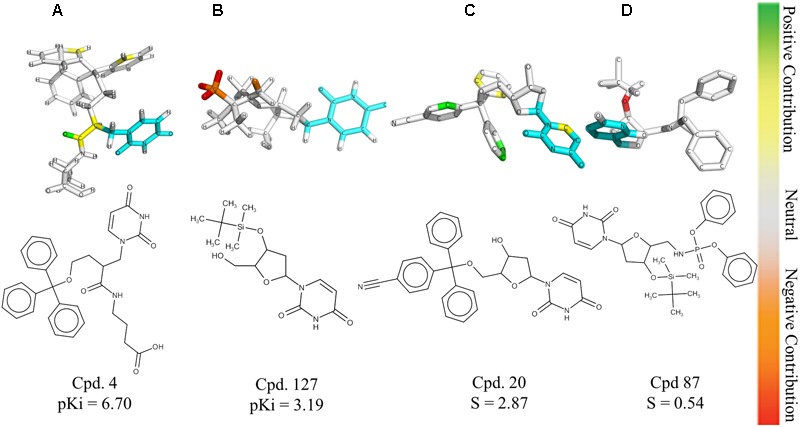
FIGURE 2.

HQSAR contribution maps for the most potent PfdUTPase inhibitor of the dataset (A, Cpd. 4) and the less potent compound (B, Cpd. 127). The most selective (C, Cpd. 20) and less selective (D, Cpd. 87) compounds are also displayed. The uracil ring, which is the common substructure, is highlighted in cyan.
