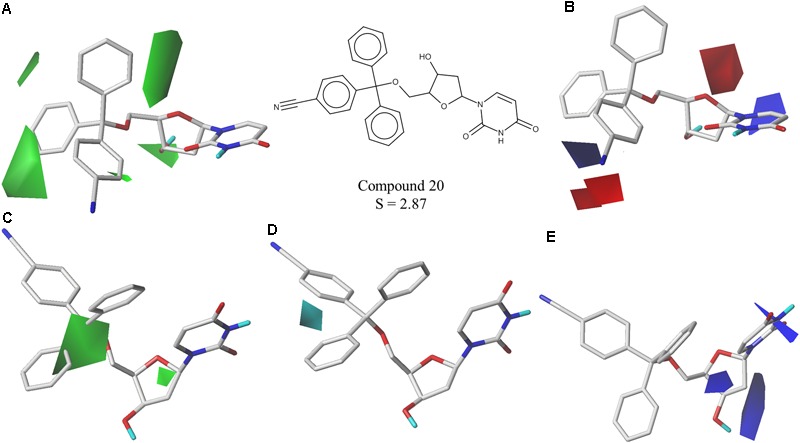
FIGURE 4.

Contour maps of the best CoMFA and CoMSIA models for selectivity surrounding one of the most selective inhibitors (cpd. 20); (A,B) CoMFA steric and electrostatic contour maps; (C–E) CoMSIA steric, hydrophobic and electrostatic contour maps. Steric fields: green contours indicate regions where bulky groups are favorable to selectivity; electrostatic fields: red contours indicate regions where electronegative groups are favorable to selectivity, while blue contours indicate regions where electronegative groups are unfavorable; hydrophobic fields: cyan contours indicate regions where hydrophobic groups are favorable to selectivity.
