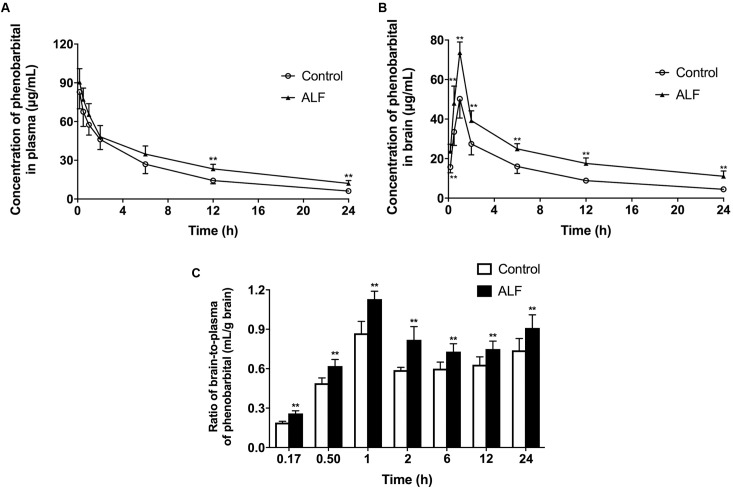
FIGURE 4.
Mean plasma (A) and brain (B) concentration-time profiles, the brain-to-plasma ratios (C) of phenobarbital in ALF (filled triangle, shaded bar), and control (open circle, white bar) mice after i.v. administration of 60 mg/kg phenobarbital. The each point and bar represents the mean ± SD (n = 6), P < 0.01 vs. control mice.

