FIGURE 5.
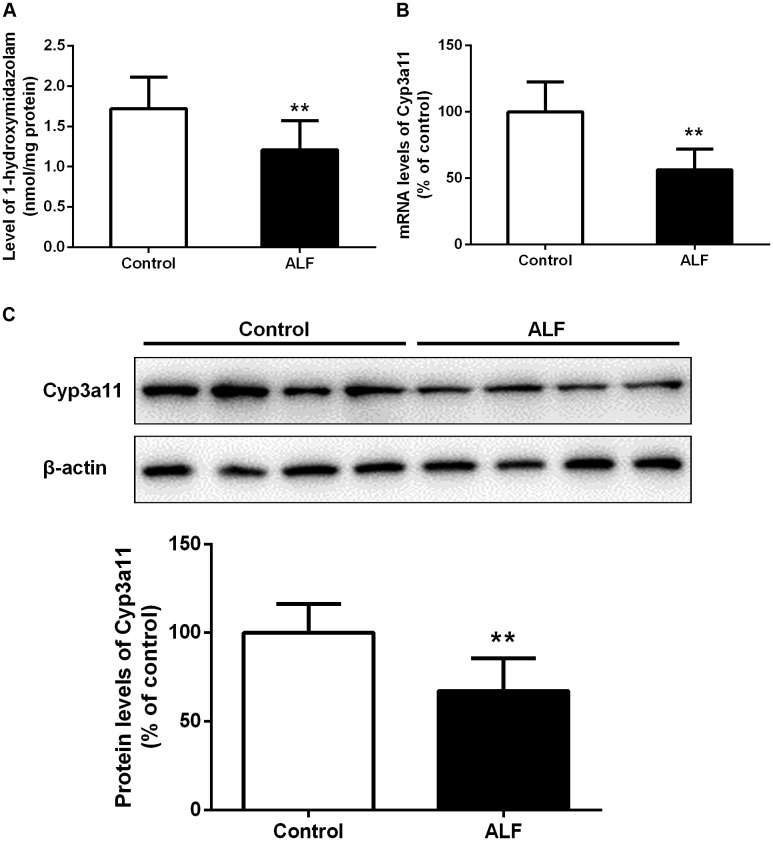
Formation of 1-hydroxylmidazolam from midazolam in hepatic microsomes of control (white bar) and ALF (shaded bar) mice (A). The relative mRNA levels (B) and protein levels (C) of Cyp3a11 in hepatic microsomes of control (white bar) and ALF (shaded bar) mice. Data represent the mean ± SD (n = 6), ∗P < 0.05, ∗∗P < 0.01 vs. control mice.

