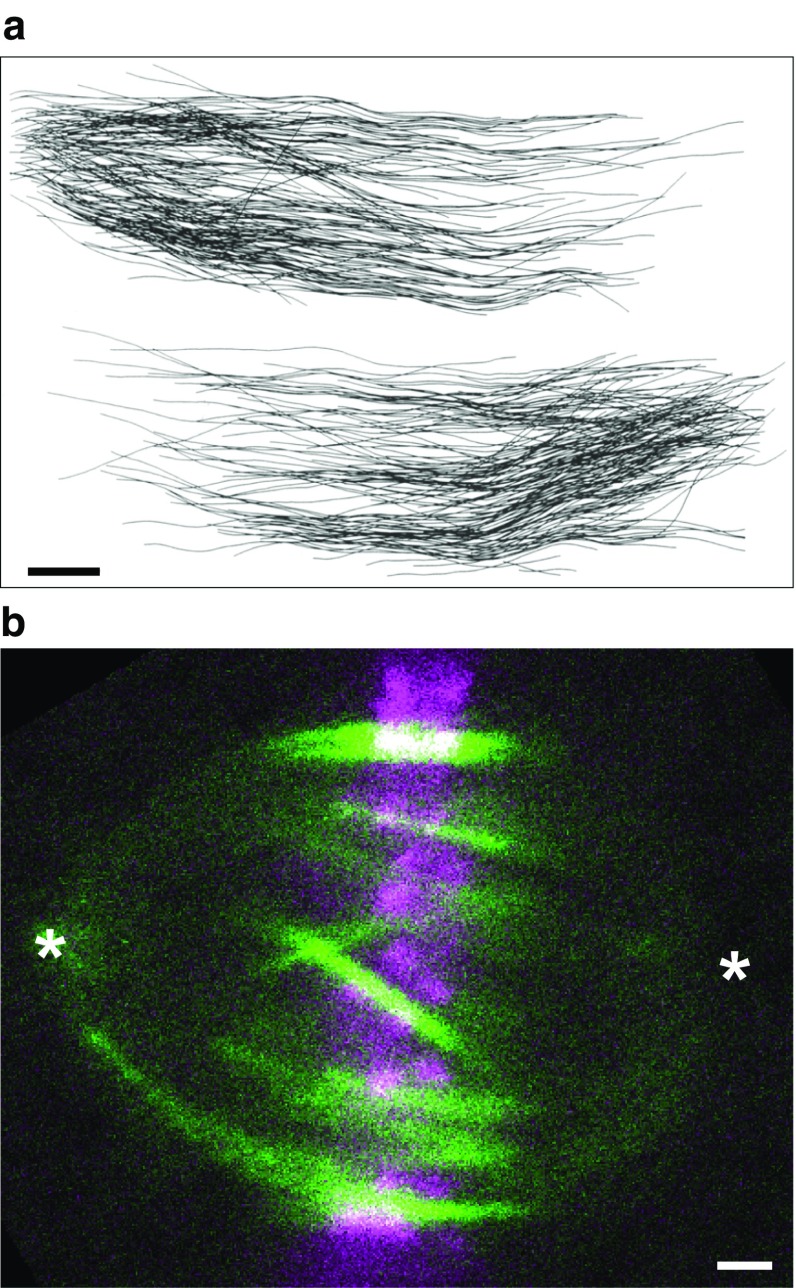
Fig. 5.
Interpolar bundles. a Interpolar microtubules in a PtK1 cell in early anaphase, reconstructed from an electron micrograph. Microtubules whose minus ends were associated with the pole on the left or the right are shown separately. Scale bar 1 µm. Image reproduced with permission from (Mastronarde et al. 1993). b Interpolar bundles in a HeLa cell visualized by PRC1-GFP (green), which binds to antiparallel microtubule overlaps. The antiparallel overlap zones are ~5 µm long and found in the central part of the spindle. Kinetochores (mRFP-CENP-B) are visible in magenta. Asterisks mark the spindle poles; scale bar 1 µm. Image reproduced with permission from (Polak et al. 2017)

