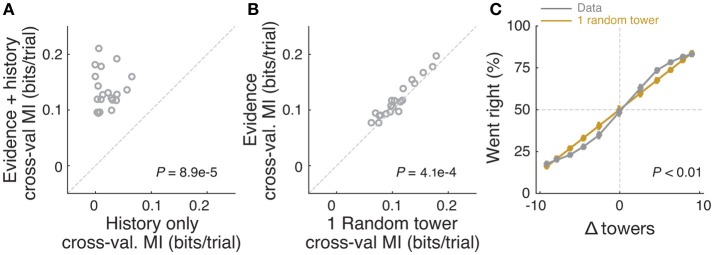
Figure 4.
Mice rely on multiple cues to perform the task. (A) Comparison of cross-validated prediction performance of a model containing both trial history and spatially binned evidence (Figure 7H) and one containing only trial history terms (n = 20 mice). MI: model information. (B) Comparison of cross-validated prediction performance of a model in which the mouse makes a decision based on a single random tower and one with spatially binned evidence (no history) (n = 20 mice). (C) Psychometric curves for the actual data and a model that chooses from each trial 1 of the presented cues (randomly) and bases the trial choice on the identity of that cue. Data is aggregated across mice for trials where the total number of cues (#R + #L) is equal to 12. In the scenario where #R + #L is fixed, we expect the “1 random cue” model's performance to be linear with #R – #L (as is borne out in the figure). In contrast, if mice used multiple cues the psychometric curve should be different from a line. The psychometric curve for the actual data (gray) is significantly different from that predicted by the ‘1 random cue’ model (yellow, P < 0.01, shuffle test, see Supplementary Materials and Methods).

