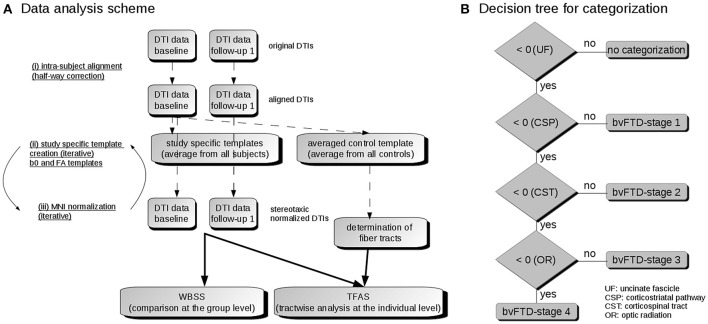
Figure 1.
(A) Data analysis scheme. (i) To obtain a common coordinate frame, baseline and follow-up DTI data were aligned by half-way correction. (ii) After landmark normalization, study-specific b0 and FA templates were created. (iii) DTI data of all visits were stereotaxically normalized in the Montreal Neurological Institute (MNI) coordinate frame in an iterative process. Then, the voxelwise statistical comparison between the patients and the control group was performed by whole brain based spatial statistics (WBSS). After averaging controls' data sets, fiber tracts were calculated from this averaged data set. Finally, tractwise fractional anisotropy statistics (TFAS) was applied. (B) Decision algorithm for categorization. From all bvFTD patients, those were further analyzed who had z-transformed TOI-FA values < 0, i.e., TOI-FA values below the FA-threshold defined for the uncinate fascicle (bvFTD-stage 1). Of this group, those were defined for bvFTD-stage 1 who had z-transformed TOI-FA-values > 0 in the corticostriatal pathway, and those were defined for bvFTD-stage 2 who had z-transformed TOI-FA-values > 0 in the corticospinal tract. The remaining individuals were categorized into bvFTD-stages 3 or 4, depending on whether their z-transformed TOI-FA-values in the optic radiation were > 0 or < 0.

