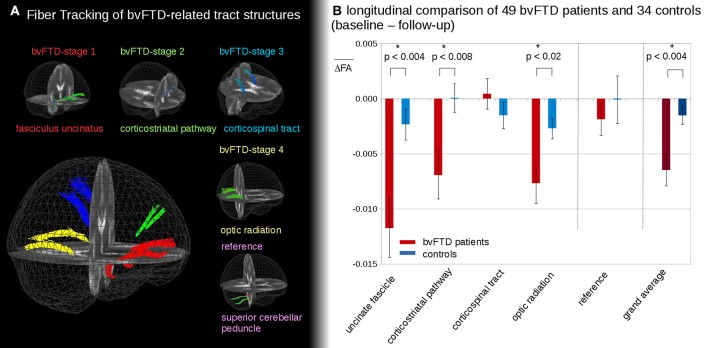
Figure 2.
(A) 3D-images of tracts of interest. 3D-images of tracts of interest: fasciculus uncinatus, corresponding to bvFTD stage 1; corticostriatal pathway, corresponding to bvFTD stage 2; corticospinal tract (CST) corresponding to bvFTD stage 3, optic radiation, corresponding to bvFTD stage 4; superior cerebellar peduncle as reference path. (B) Longitudinal FA differences in stage-related tract systems. Longitudinal averaged FA differences (baseline—follow-up) in tracts at the group level—*significance.

