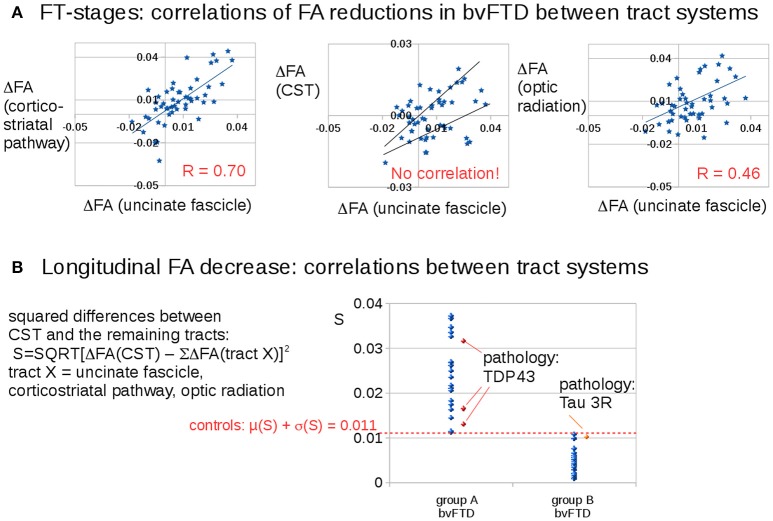
Figure 3.
Longitudinal FA decrease in different tract systems: prominent differences for the CST (bvFTD stage 3). (A) Correlations of FA reductions in bvFTD patients between tract systems. (B) Squared differences of FA decrease in the CST compared to averaged FA decreases in the other tract systems. A “dichotomous” behavior was identified: one bvFTD subgroup A (N = 22) with an FA decrease in the CST which is different to the FA decrease in the other stage-related tract structures (S > 0.011) and the other subgroup (group B, N = 29) with an FA decrease in the CST which is similar to the FA decrease in the other stage-related tract structures (S < 0.011). The four available pathology results were indicated in red/orange.

