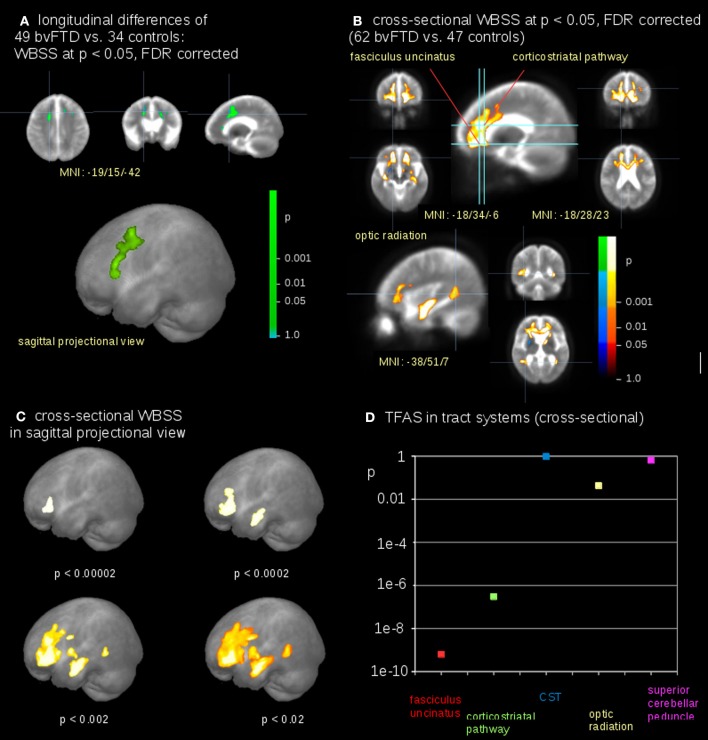
Figure 4.
Comparison at the group level—bvFTD-patients vs. controls. (A) Whole brain-based spatial statistics (WBSS) of longitudinal alterations in FA maps of 49 bvFTD-patients vs. 34 controls (at FDR corrected p < 0.05). (B) WBSS of FA maps of 62 bvFTD-patients vs. 47 controls (at FDR corrected p < 0.05). (C) Whole brain-based spatial statistics (WBSS) of FA maps (FDR corrected) in sagittal projectional views for different significances. (D) Significance levels for TFAS of tract systems corresponding to bvFTD-stages: fasciculus uncinatus (bvFTD stage 1), corticostriatal pathway (bvFTD stage 2), corticospinal tract (CST) (bvFTD stage 3), optic radiation (bvFTD stage 4), and as the reference path the superior cerebellar peduncle.

