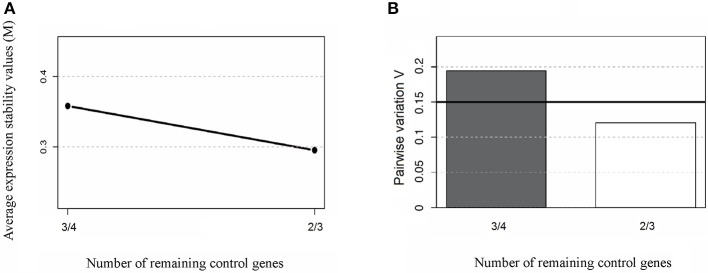
Figure 1.
Average expression stability of endogenous miRNAs. Ranking of the gene expression stability (M) performed in all samples analyzed in the study during stepwise exclusion (A). A lower M-value indicates more stable expression. The least stable genes are on the left using the spike-in cel-miR-39 control gene; and the most stable genes are represented on the right using the expression of endogenous hsa-miR-221-3p and hsa-miR-484 as references. The non-related microRNAs hsa-mir-221-3p and hsa-miR-484 were used for relative normalization as endogenous controls. The optimal number of control genes was determined for normalization by Pairwise variation (B), as described in section Materials and Methods.

