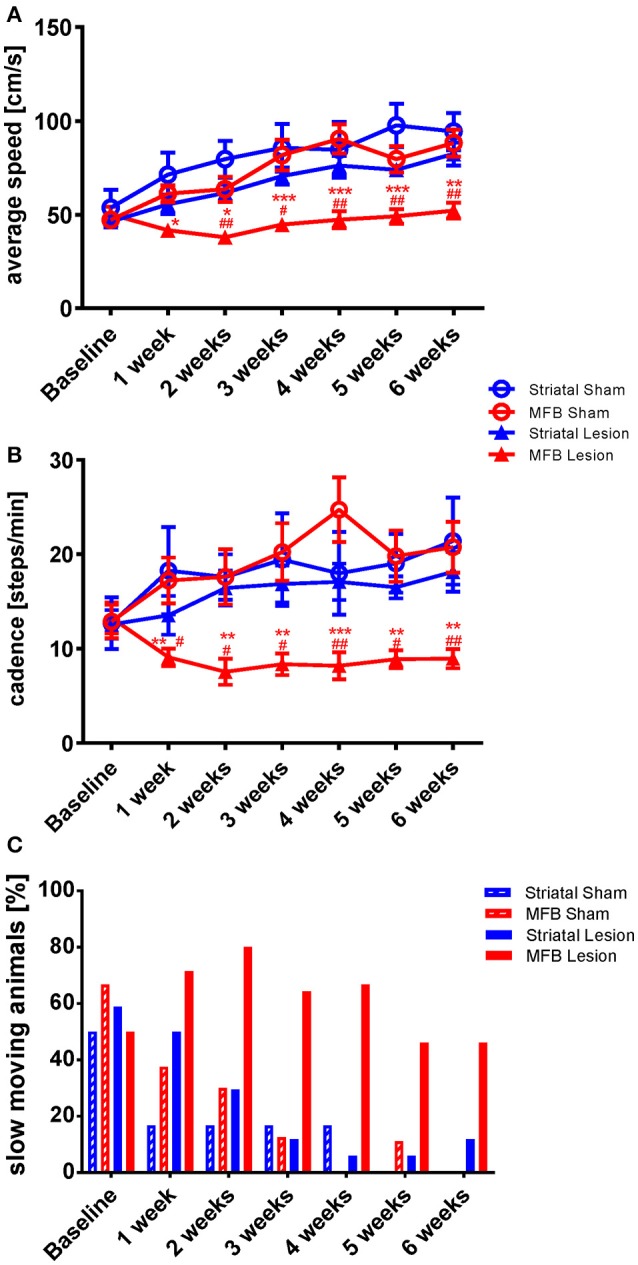
Figure 2.

Kinetic variability of gait following MFB or striatal 6-OHDA lesions. Graphs demonstrating the inter-dependent variables (A) average speed of a run, (B) the total number of steps taken per minute (cadence) and (C) the percentage of slow moving rats within each cohort. Data shown as mean ± s.e.m (A,D) or percentage (C). *Indicates a significant difference on the lesion group when compared to its control (blue for striatal cohort and red for MBF cohort) and #indicates differences of MFB lesion vs. striatal lesion animals. *P ≤ 0.05; **P < 0.01; ***P < 0.001 (Two-way repeated measures ANOVA with Tukey's or Dunnett's post-hoc multiple comparison).
