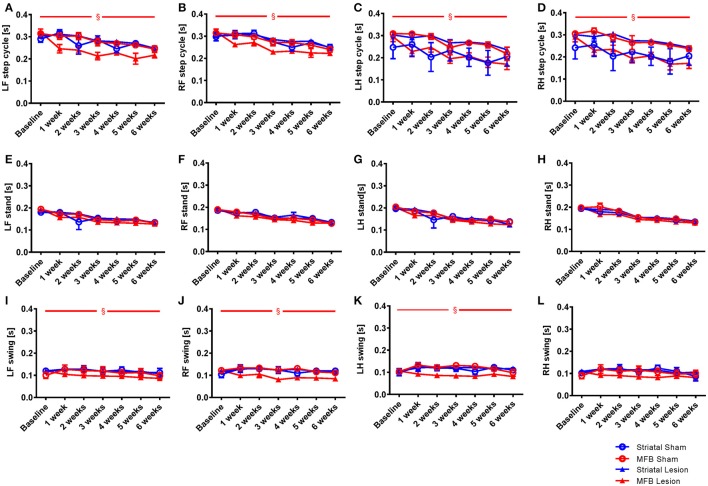
Figure 4.
Length of step cycle and its components stand phase and swing phase following MFB or striatal 6-OHDA lesioning. Graphs demonstrating: (A–D) the time in seconds between two consecutive initial contacts of the same paw (step cycle) and consists of the stand and swing phase; (E–H) the duration in seconds of contact of a paw with the walkway (stand); (I–L) the duration in seconds of no contact for a paw with the walkway (swing). LF, Left front; RF, right front; LH, left hind; RH, right hind. Data shown as mean ± s.e.m. (Two-way repeated measures ANOVA). §Influence of the treatment factor independently, when comparing the four different groups.

