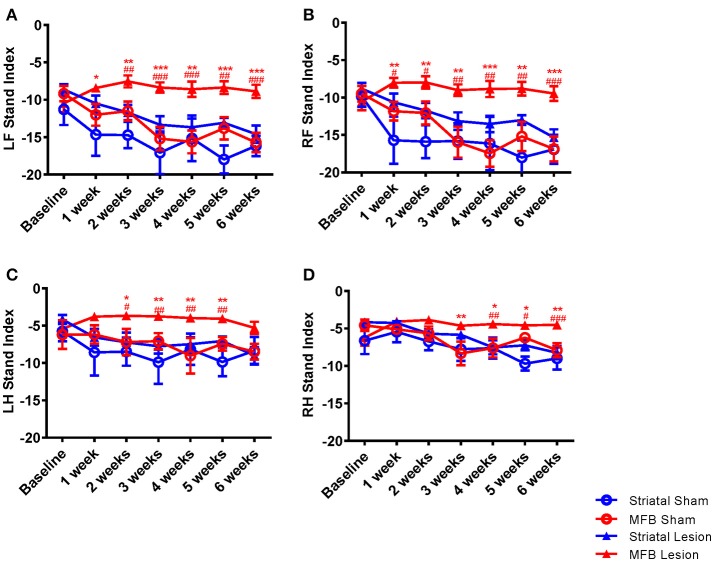
Figure 5.
Graphs demonstrating the stand index following MFB or striatal 6-OHDA lesioning. (A) LF: left front, (B) RF: right front, (C) LH: left hind, and (D) RH: right hind. Data shown as mean ± s.e.m. *Indicates a significant difference on the lesion group when compared to its control (blue for striatal cohort and red for MBF cohort) and #indicates differences of MFB lesion vs. striatal lesion animals *P ≤ 0.05; **P < 0.01; ***P < 0.001 (Two-way repeated measures ANOVA with Tukey's or Dunnett's post-hoc multiple comparison).

