Figure 4.
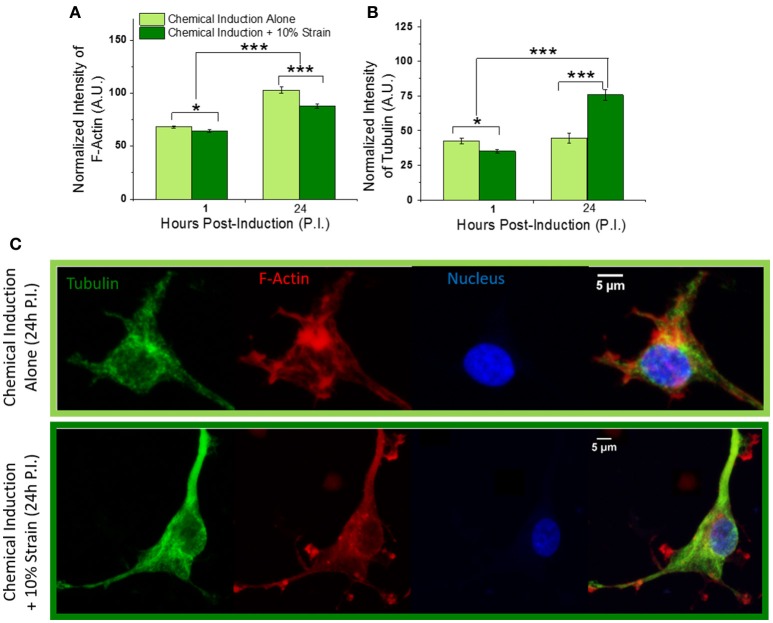
Effect of mechanical strain on OPC cytoskeleton. (A) Total fluorescence intensity of F-actin and (B) tubulin normalized by actin and tubulin volume, respectively, at 1 and 24 h post-induction of differentiation, for strained and unstrained OPCs. F-actin levels increase to similar extent for strained and unstrained cells with differentiation time progression from 1 to 24 h; F-actin expression is reduced in response to strain, by 6 and 15% at 1 and 24 h post induction, respectively. Tubulin levels increases by 70% in strained cells at 24 h time point. (C) Examples of F-actin (red) and microtubule (green) cytoskeleton in unstrained (top) and strained (bottom) cells at 24 h time point; Hoechst nuclear staining in blue. Scale bar 5 μm. N = at least 20 cells per condition. Error bars are SEM (standard error of the mean); *p < 0.05, ***p < 0.001.

