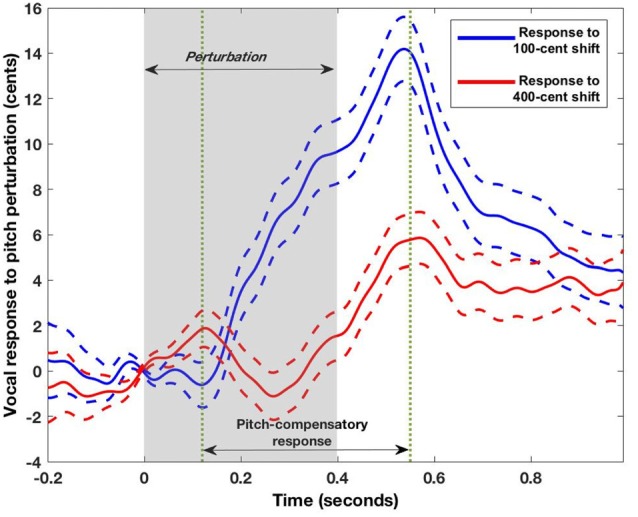
Figure 3.

Mean pitch perturbation response tracks (±100 and ± 400) averaged across all participants (N = 19). The positive values of both contours indicate that the average response to both upward and downward shifts was compensatory. Participants began responding to the applied perturbation at an average of 120 ms after perturbation onset and peak response was attained at an average of 550 ms after perturbation. Dashed lines represent the standard error of the corrective responses across all trials and participants.
