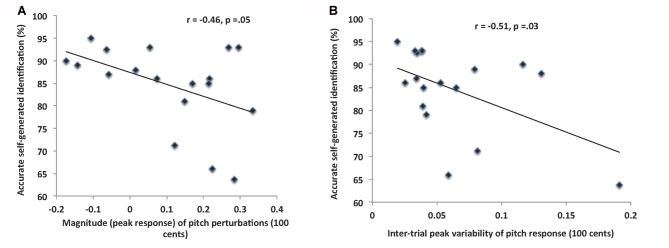
Figure 4.
(A) The scatterplot illustrates the significant negative correlation between peak response to 100 cents pitch perturbations and judgments of self-agency on the reality monitoring task. (B) The scatterplot illustrates the significant negative correlation between the inter-trial variability in peak response to 100 cents pitch perturbations and judgments of self-agency on the reality-monitoring task.

