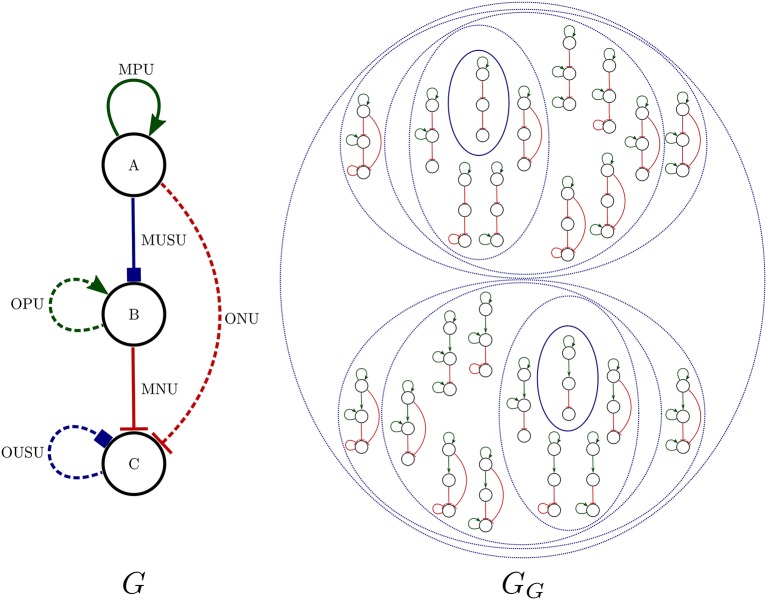
Figure 1.
Left: An R-graph G. Right: The set of all instantiations of G, GG (see definition 12). In the radial exploration strategy used by Griffin there are two centers contained in the continuous ovals. The nested dotted ovals illustrate regulation graphs that are at a certain radius from each center: continuous oval for radius 0, inner dotted ovals for radius 1, second inner dotted ovals for radius 2 and so on. In this example, each regulation graph of GG corresponds to an R-graph of a query member of a query splitting. The strategy used for this query splitting is shown in Algorithm 2. In general, the number of queries in the query splitting does not correspond to the number of instantiations of an R-graph, due to the fact that a member of the splitting may not have satisfying solutions, while all instantiations of G have satisfying solutions.

