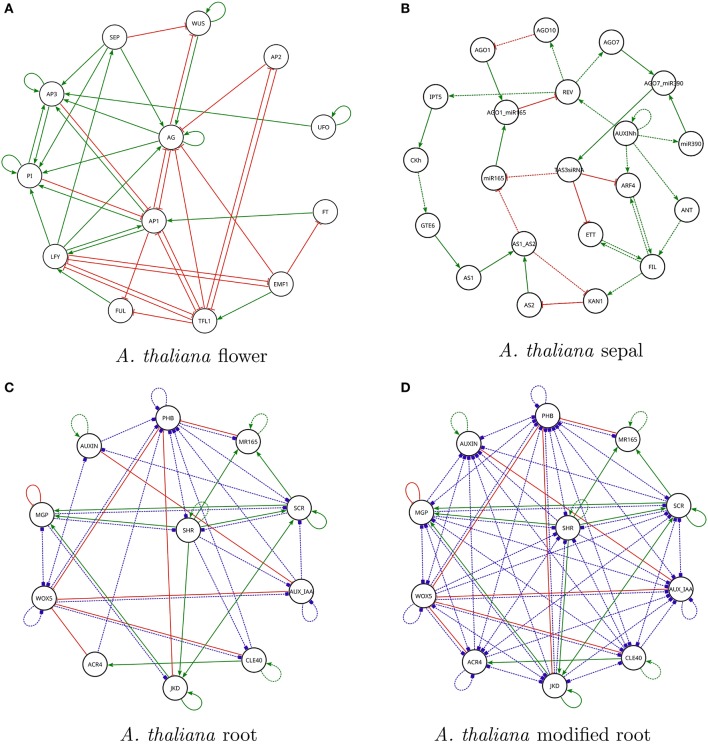
Figure 3.
Regulation graphs for A. thaliana models used in the section Case Studies. (A) Flower development model of Alvarez-Buylla et al. (2010). Nodes LUG and CLF have been omitted from the diagram because they are constant inputs to the model. (B) Sepal primordium polarity model of La Rota et al. (2011). For all figures: positive regulations are shown as green lines with arrow tips, negative regulations are shown as red lines with orthogonal line tips, dashed lines represent hypothetical interactions (it is unknown whether they are present or not). Blue dashed lines with square tips represent hypothetical interactions of unknown sign. (C) Root cell stem niche model of Azpeitia et al. (2013). (D) Modified root cell stem niche model of Azpeitia et al. (2013) is shown with several new hypotheses.

