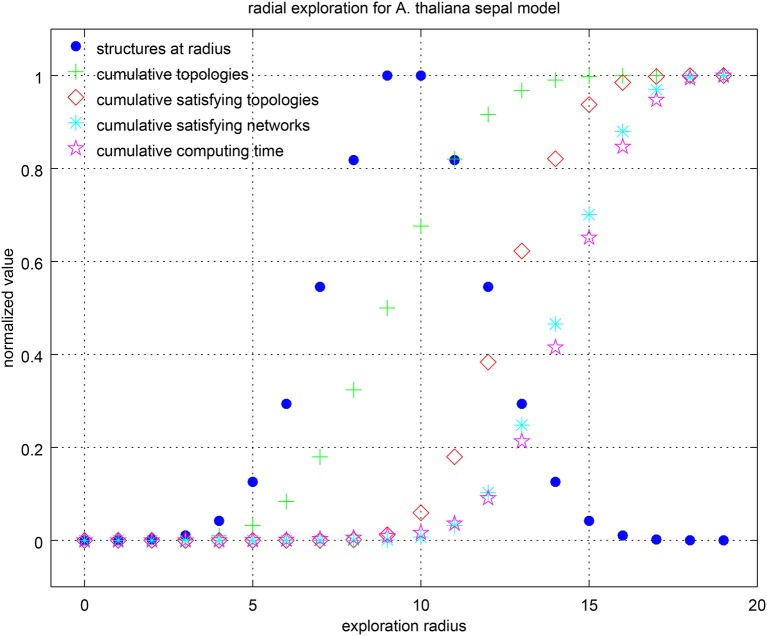
Figure 8.
Center-radius exploration strategy for the sepal model. Values have been normalized by their maximum in each category. The number of R-graphs grows rapidly with the radius. It is given by the binomial coefficient , where h is the number of hypotheses and r the radius. It can be seen that the computing time is highly correlated with the number of cumulative satisfying networks.

