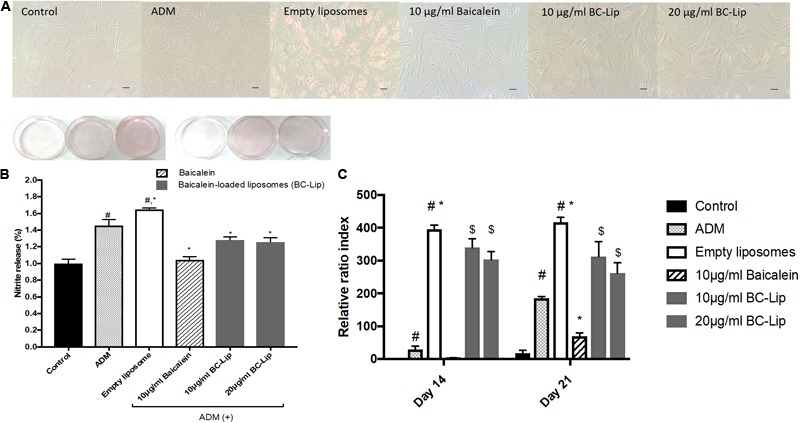
FIGURE 5.

Lipid accumulation in human dermal fibroblasts, Hs68 (A) after the differentiation, lipid accumulation in the cells was stained with Oil Red O dye and visualized under a microscope at 100x of magnification. (Scale bar = 200 μm). (B) The quantification of lipid accumulation in Hs68 cells was measured using an ELISA reader at 500 nm. The data are presented as relative index to control, and the results were expressed as means ± standard deviation (n = 3–5). (C) Intracellular triglyceride content were determined with TG adipogenesis kit at 570 nm in Hs68 cells after 14 and 21 days of incubation with 20% ADM. The results were expressed by the mean intensity of triglyceride compared to control ± standard deviation (n = 3–8). #P < 0.05 relative to control, ∗p < 0.05 relative to cells treated with ADM and $p < 0.05 relative to cells co-treated with ADM and empty liposomes.
