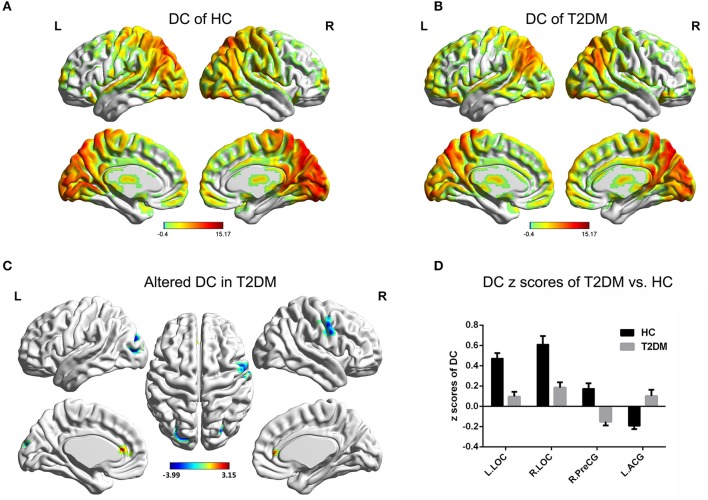
Figure 1.
DC value distribution of intra-group and inter-group comparisons. (A,B) The spatial distribution of the DC value in the HC group and T2DM group. (C) The significantly altered DC map in the T2DM group. (D) Comparison of DC value between the two groups. AlphaSim corrected (p < 0.001, cluster size > 20 voxels). The color bar denotes the t-value. Error bars define the SEM. ACG, anterior cingulate gyrus; LOC, lateral occipital cortices; PreCG, precentral gyrus; R, right; L, left.

