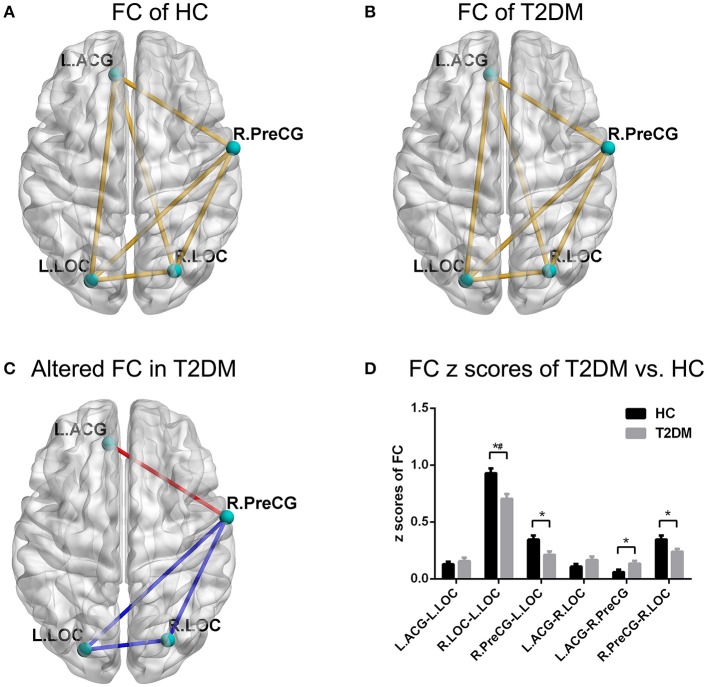
Figure 2.
FC pattern of intra-group and inter-group comparisons. (A,B) The FC pattern in the HC group and T2DM group. (C) The significantly altered FC in the T2DM group. (D) Comparison of FC z scores between the two groups. *p < 0.05, #p < 0.05/6 (Bonferroni correction). Error bars define the SEM. ACG, anterior cingulate gyrus; LOC, lateral occipital cortices; PreCG, precentral gyrus; R, right; L, left.

