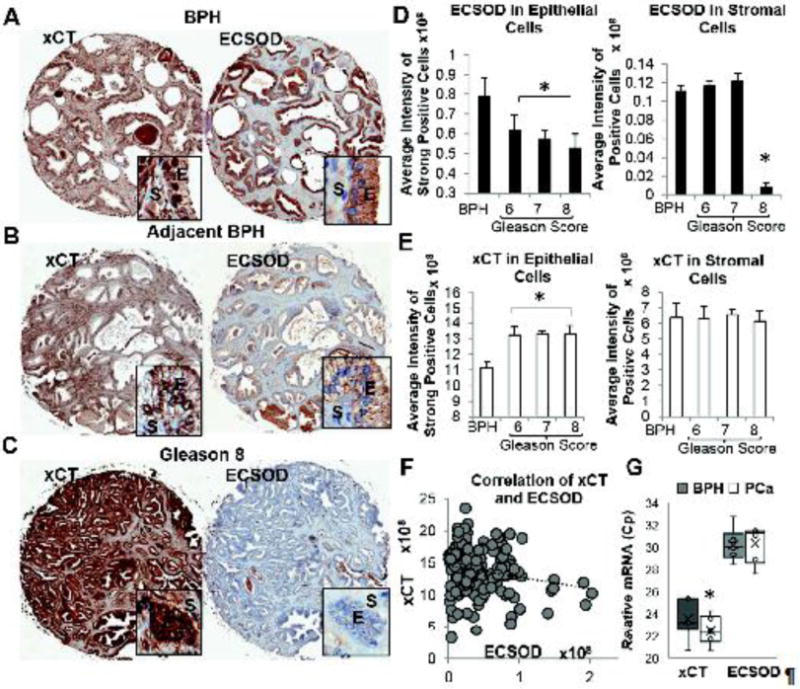
Figure 1. Quantitative analysis of ECSOD and xCT expression in PCa tissues.

Reversible expression pattern of ECSOD and xCT on the same tissues: (A) BPH=Benign Prostatic Hyperplasia, (B) Adjacent BPH counterpart; and (C) PCa tissue (B and C are from the same patients). E=Epithelial cells, S=Stromal cells. Image magnifications: 20X for tissues and 400X for inserts. Quantitative analysis of (D) ECSOD and (E) xCT expression. ECSOD expression is significantly decreased in PCa epithelial areas while xCT expression is significantly increased in PCa epithelial areas. Intensity from strong positive area of epithelial cells was used for the analysis. (F) A negative linear correlation of ECSOD vs. xCT in PCa epithelial areas with Pearson r value = −0.198 and p-value = 0.018. Total pixel intensity of all areas (weak, medium, and strong positive areas) was used for the analysis. (G) RT-qPCR of ECSOD and xCT in prostate tissues. Relative mRNA levels of ECSOD and xCT were quantified by qRT-PCR as described in Materials and Methods. Lower Cp value indicates higher expression level. *p ≤ 0.05 when compared to BPH.
