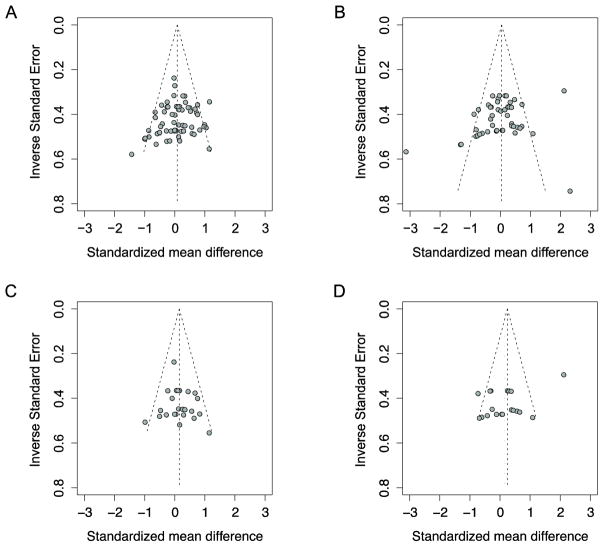
Figure 3. Symmetrical funnel plots suggest no evidence of publication bias based on amplitude effect sizes from (A) the full sample and (C) the counterbalanced sample. In contrast, some evidence of publication bias based on latency effect sizes from (B) the full sample and (D) the counterbalanced sample.
Egger’s regression tests: A. Intercept = −1.23 [95% standard error confidence interval: −2.88–0.41], t = −1.47, p>0.05; B. Intercept: −3.16 [95% standard error confidence interval: −5.90– −0.42], t = −2.26, p=0.02. C: Intercept: 0.57 [95% standard error confidence interval: −1.55–2.68], t=0.53, p>0.05. D: Intercept: −6.03 [95% standard error confidence interval: −11.29– −0.76], t=−2.24, p=0.04

