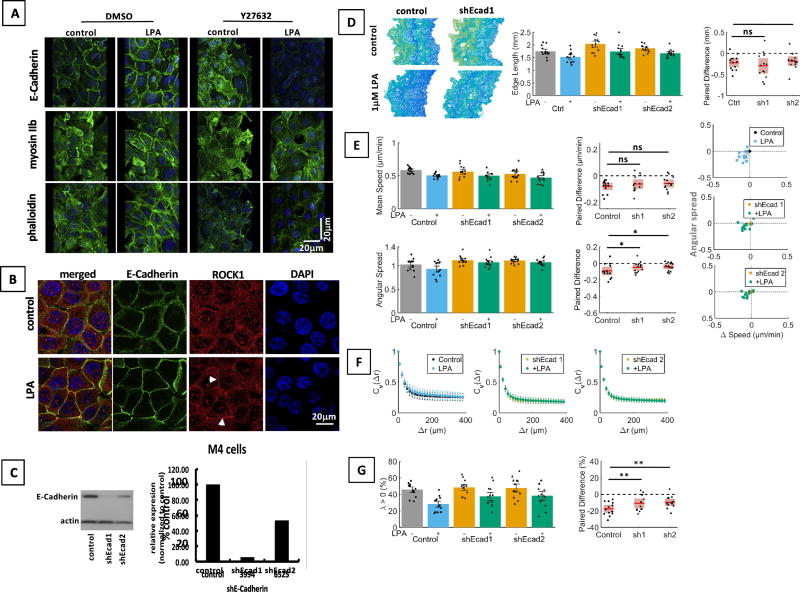
Fig. 4. The Rho/Rock signaling cascade mediates membrane localization of E-Cadherin.
A. Inhibition of ROCK1 with Y27632 (10µM) reduces effects of LPA on E-Cadherin-, F-actin- and myosin IIb staining patterns as shown by immunofluorescence. Cells were serum starved (0.1% horse serum) for 3 h, and then stimulated with 1 µM LPA for 30 min. Images presented are rotated 3D renderings (40°, y-axis) of Z-stacks Green: E-Cadherin or myosin II or phalloidin; blue: nuclei. Scale bar applies to all images of this panel. B. LPA induces localization of ROCK1 to E-Cadherin containing adherens junctions as shown by immunofluorescence. Scale bar applies to all images of this panel. C. shRNA was used to downregulate E-Cadherin protein expression in MCF10CA1a cells as shown by Western blotting. D–G. Low expression of E-Cadherin alters the migratory response of MCF10CA1a cells to LPA. Cells were serum starved for 3 h before stimulation with LPA and time-lapse imaging. Cells with low E-Cadherin expression still respond to LPA with a shortening of the colony edge (ANOVA / Sidak’s multiple comparison test, D) and reduced speed (Friedman / Dunn’s multiple comparison test, E). However, normal E-Cadherin levels are required for effect of LPA on angular spread (ANOVA, Sidak’s multiple comparison test, E), and λ (ANOVA / Sidak’s multiple comparison test, G). n = 13 experiments.

