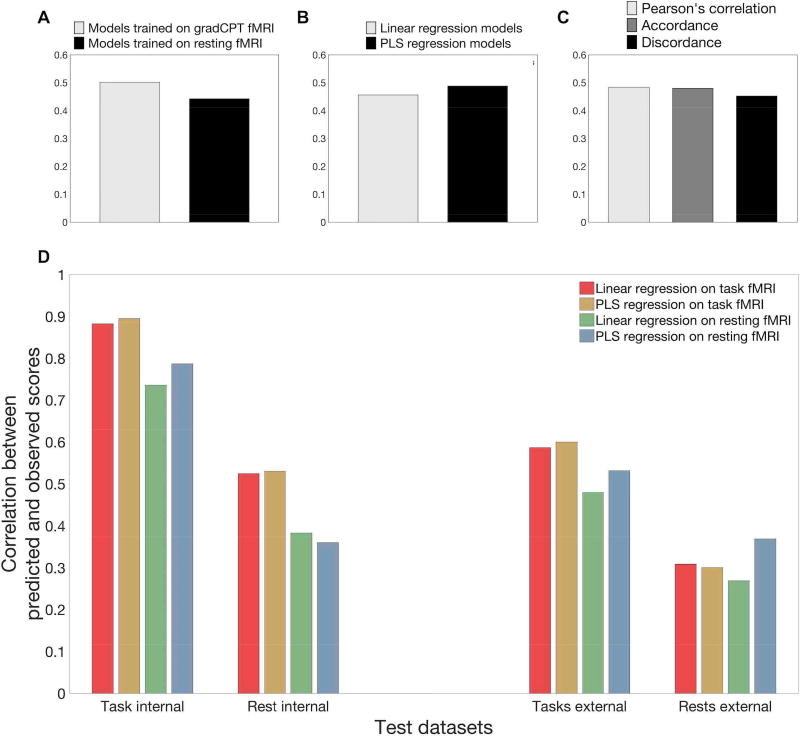
Figure 2. Average performance of twelve connectome-based predictive models (CPMs) in internal and external datasets.
(A) Mean performance of all models trained on gradCPT task vs. gradCPT rest data. (B) Mean performance of all linear vs. all PLS regression models. (C) Mean performance of all Pearson’s correlations vs. accordance vs. discordance models. (D) For the internal validation columns, bars represent predictive power averaged across connectivity measures. For the external validation columns, bars represent predictive power averaged across connectivity measures and datasets. For example, the “task external” group came from averaging the results from testing on stop-signal task-based fMRI and testing on ANT-based fMRI. The “rest external” group was obtained from averaging the results from testing on resting-state fMRI from the three external datasets.

