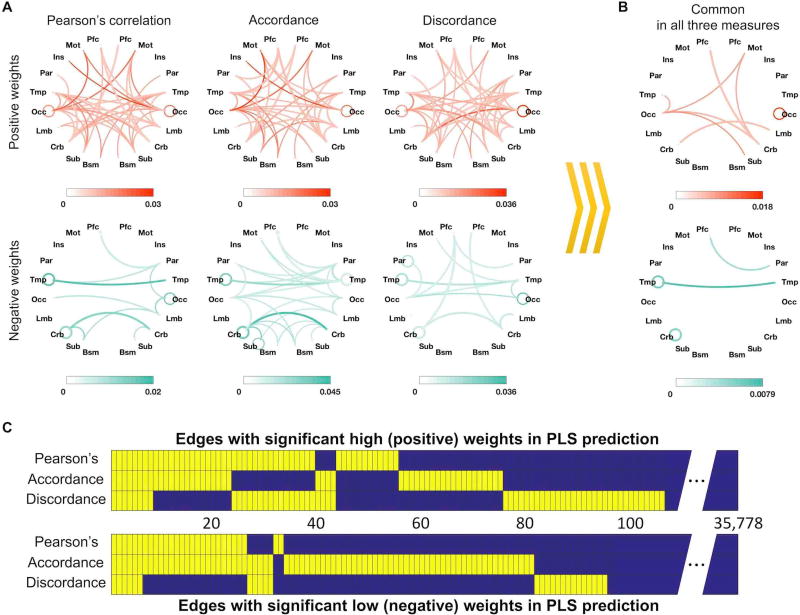
Figure 3. Edges with significant weights shared across PLS CPMs using different functional connectivity features.
This figure shows edges with a significant beta coefficient in the three PLS prediction models using the three different connectivity measures. (A) Anatomical distribution of significant edges in each model; color saturation represents proportion relative to total number of possible edges between each pair of anatomical regions. (B) Edges that had significant weights in all three models. (C) Significant edges are shown in yellow for each model, and common edges across models are aligned vertically. 106 edges (of a possible 35,778) had significant positive weights, and 95 edges had significant negative weights in at least one connectivity measure (two-tailed p < 0.05 based on 106 permutations).

