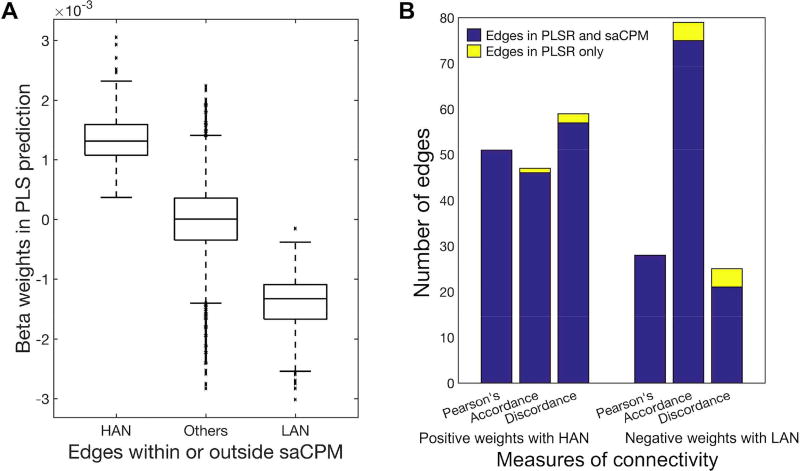
Figure 6. Comparison between significant edges from PLS and linear regression.
(A) PLS regression beta weights in the saCPM’s high-attention network (HAN), low-attention network (LAN), and in neither. (B) Edges with significant PLS weights that are also included in the HAN or LAN are shown in blue; edges with significant PLS weights that are not included in the HAN or LAN are shown in yellow.

