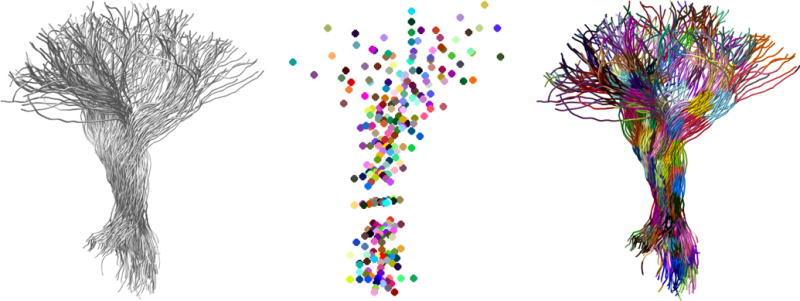
Figure 1. Parcellation overview.

(left) Left Thalamic Radiation (LTR) fiber bundle; (middle) Seed Points representation models the geometry of the bundle. Each node on the bundle is assigned to one of the SeedPoints using a nearest-neighbor approach; (right) parcellated LTR bundle – each color represents a different cluster. Cluster location is visually consistent across subjects in a given dataset.
