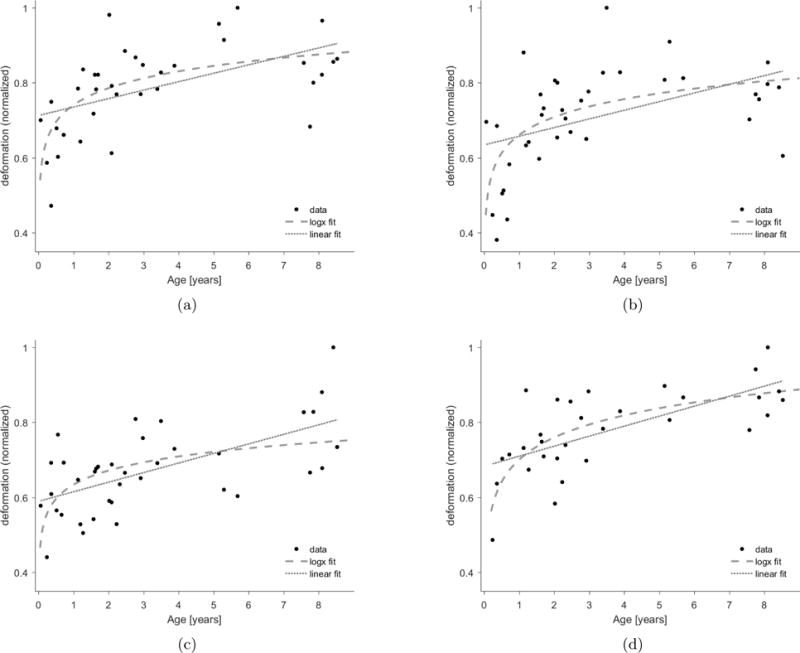
Figure 12. Fiber bundle deformation curve data and fitted logarithmic and linear curve for four different pathways.

(a) Callosum forceps major; Logarithmic model: y = 0.74 + 0.15 · log(x). (MSE=0.008). Linear model: y = 0.71 + 0.02 · x. (MSE=0.01). (b) callosum forceps minor; Logarithmic model:·y = 0.66 + 0.15 · log(x). (MSE=0.011). Linear model: y = 0.63 + 0.02 · x. (MSE=0.014). (c) left corticospinal; Logarithmic model: y = 0.63 + 0.12 · log(x). (MSE=0.008). Linear model: y = 0.59 + 0.02 · x. (MSE=0.007). (d) left inferior fronto-occipital; Logarithmic· model: y = 0.7 + 0.19 · log(x). (MSE=0.005). Linear model: y = 0.68 + 0.02 · x. (MSE=0.006).
