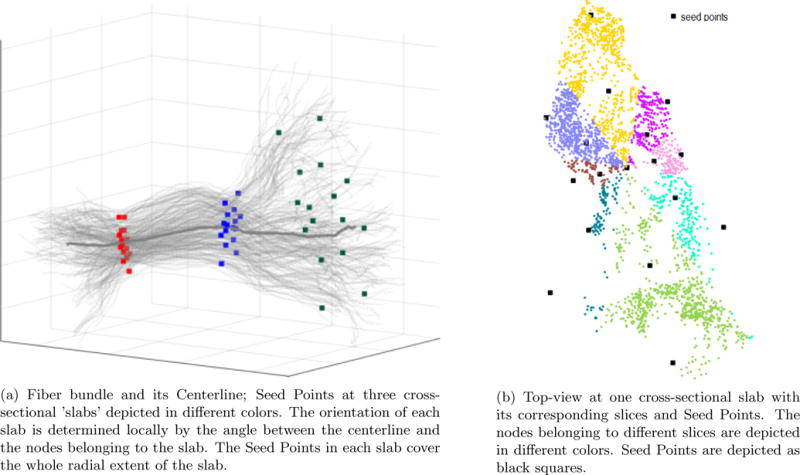
Figure 2. Seed Points placement procedure.

The calculated model captures the nature of the fiber bundle shape along the fibers and across the fibers. Left – fiber bundle (thin gray curves) with centerline (thick gray curve) and Seed Points at three cross-sections. Right – top-view on one cross-sectional ‘slab’.
