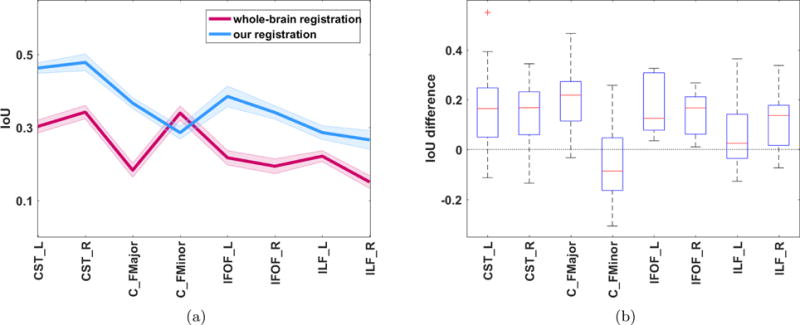
Figure 6. Comparison to FA-based nonlinear Whole-brain based registration.

(a) IoU (Intersection over Union) for eight bundles across 35 subject pairs – comparison of WBR and MBR. The plot shows mean values across all 35 pairs are shown in bold lines ± one standard error of the mean. (b) Boxplot of the differences in IoU between MBR and WBR. The central mark (red) represents the median, the edges of the box (blue) are the 25th and 75th percentiles, the whiskers extend to the min and max values. Difference values above 0 indicate that MBR performed better.
