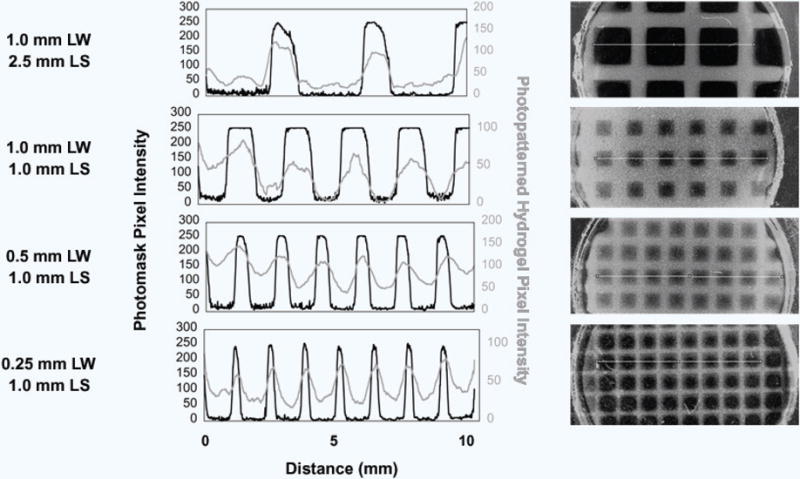
Figure 3. Change in Pixel Intensity across the Photopatterned CMA Hydrogel and High Resolution Photomask.

Pixel intensity measurements of photopatterned line widths (LW) and line spacings (LS) across the photopatterned hydrogels were compared to respective intensity changes across the photomask. Overlaid images (right) show the tracing for the intensity measurement (left) in the photopatterned hydrogel (gray, gray line) and the photomask (black and clear, black line). Evidence of excess free radical production causing over-photocrosslinking can be seen in these images as the rounded corners in the square pore areas of the photomask. All intensity peaks in the photopatterned hydrogels corresponded to the same peaks in the photomask. However, the slope of the change in intensity is lower in photopatterned hydrogels compared to the photomasks, caused by diffusion of free radicals that caused excess photocrosslinking.
